
Hi, at current article I want to share with you interesting practical “journey” related with AWS RDS MariaDB optimizations, that I recently have passed. All started from rebranding TV campaign for web service. Current service have been using AWS RDS MariaDB as a main place for preserving data, ant it was deployed using db.t3.xlarge (4 CPU, 16 Gb RAM) instance type with Multi-AZ. I will call it rdsA further in the text. The rdsA consisted with 2 databases inside it – let call it databaseA and databaseB for further explanations. Before rebranding, rdsA already had some performance problems – often peaks at CPU utilization and RDS disk queue. It mostly happened for some short periods of time (2-5 min) and it was indeed hard to debug the issue. Together with that, scaling instance to db.t3.2xlarge does not look to be some good idea from cost’s perspective.
Though, the most strange and unpleasant was the fact of throwing often dead log exceptions from db side at application layer by itself. Several people were trying to debug and resolve the problem – but despite all efforts, within half a year, that magic errors at logs were still constantly present. Because of rebranding, the demand of “scaling up” appeared. And as result of that – all problems with rdsA were finally discovered and solved, even after all resources were scaled down back to previous values, when rebranding campaign was finished. Let me tell you how it happened 🙂
To meet TV campaign requirement next steps were applied in scaling up AWS RDS resources:
- databaseA was moved at own AWS RDS db.t3.large (2 CPU, 8Gb RAM) instance, preserving Multi-AZ
- databaseB remained at db.t3.2xlarge (4 CPU, 16 Gb RAM) instance type with Multi-AZ, but read replica with db.t3.2xlarge (4 CPU, 16 Gb RAM) was additionally added
- all AWS monitoring tools were enabled, but in addition Zabbix agent was connected at every RDS instance
It is worth to mention one essential thing – the web application was written with initial supposition, that read replicas can be used in future – and that was “shot in 10” as appeared further. After switching at new configuration on test environment, selenium tests discovered some problems at using read replica at first – but only some small fixes were required. In 2 days I could deal with that and all worked as it should be. So, we successfully started with current configuration during TV campaign. And despite traffic was a little bit higher, it still was much more lower then expected. After 1 week it was clear, that our scaled up instances are “boring” and we are simply losing money in vain. I’ve started to analyse monitoring metrics to check how far can we scale down. And here I started to notice some strange things, which was not possible to notice previously.
First strange things appeared from Zabbix monitoring. You, probably, have a question what is for at all – AWS already provides us with built in monitoring tools? The deal is Zabbix allows to monitor number of Select/Update/Inset/Delete operations – that is what I consider to be very useful, but, unfortunately such metrics are absent at AWS RDS monitoring. And it indeed helped a lot in resolving the puzzle. So, what I’ve noticed, is that databaseA is very “Insert” intensive. While observing graphs I understood, that there are some regular peaks at it, and all showed that current peaks, in case it was correlated with high disk consumption from databaseB at the same time, caused RDS disk queue alerts. I also noticed some more interesting things which were hidden when 2 databases were sharing the same resources. So, I decided to leave databaseA at own instance, but scale it down as much as possible.
The second interesting observation was that, there were moments when read replica had to process huge amounts of “Select” operations. There was no regular pattern in it, but it was short periods of time. So, idea, that it can explain dead lock db exceptions came to me. I started to think about it more deeper. What if there is some intensive “Select” operations at the same DB table, when a lot of Insets are coming at the same time? Probably it will cause dead locks. In case inserts and selects are separated and are performed at own instances/tables – it means that dead locks had to be absent. And indeed, when I checked logs – I did not find any errors related with that at all. Though maybe my supposition is wrong, and problem was resolved because of increasing resources. There was only way to check it – scale instances down as much as possible, but preserve read/write instance separation.
And here the main problems started – it appeared that scaling down at new circumstances is far from pleasant operations. In case CPU all was clear – it was obvious that, dependently at concrete instance CPU utilization metrics, it could be decreased at 2-4 times. Problem appeared with RAM. The only monitoring parameter you have under the hand at AWS, which is related with memory, is FreeableMemory. But what is means in the end:
The amount of available random access memory.
For MariaDB, MySQL, Oracle, and PostgreSQL DB instances, this metric reports the value of the
From AWS documentationMemAvailablefield of/proc/meminfo.
Does it tell you something? For me, not a lot 🙂 . It appeared that in practice, it works in the next way. There is one very essential parameter related with memory in case MariaDB, and it is called innodb_buffer_pool_size. This parameter decides the size in bytes of the buffer pool, the memory area where InnoDB caches table and index data. This parameter is one of the most important settings in your MySQL instance, and often 80 percent or more of memory is allocated here. The default value for this parameter in RDS is {DBInstanceClassMemory*3/4}, rest of memory remains for RDS instance and OS. So, the main question, which you have to get answer is the next one: If all read operations are performed within the allocated RAM? To check it, I recommend to use mysqltuner tool. While running it you will see the response, similar at the one represented at example below:
-------- Performance Metrics -----------------------------------------------------------------------
[--] Up for: 40d 11h 57m 43s (295M q [84.418 qps], 7M conn, TX: 345G, RX: 140G)
[--] Reads / Writes: 90% / 10%
[--] Binary logging is enabled (GTID MODE: ON)
[--] Physical Memory     : 16.0K
[--] Max MySQL memory    : 16.0G
[--] Other process memory: 0B
[--] Total buffers: 11.2G global + 3.3M per thread (1300 max threads)
[--] Performance_schema Max memory usage: 697M
[--] Galera GCache Max memory usage: 0B
[!!] Maximum reached memory usage: 12.1G (79400955.76% of installed RAM)
[!!] Maximum possible memory usage: 16.0G (104936955.76% of installed RAM)
[!!] Overall possible memory usage with other process exceeded memory
[OK] Slow queries: 0% (882/295M)
[OK] Highest usage of available connections: 6% (84/1300)

[...]
-------- InnoDB Metrics ----------------------------------------------------------------------------
[--] InnoDB is enabled.
[--] InnoDB Thread Concurrency: 0
[OK] InnoDB File per table is activated
[OK] InnoDB Buffer Pool size ( 11.0G ) under limit for 64 bits architecture: (17179869184.0G )
[!!] InnoDB buffer pool / data size: 11.0G / 53.9G
[!!] Ratio InnoDB log file size / InnoDB Buffer pool size (4.54545454545455%): 256.0M * 2 / 11.0G should be equal to 25%
[--] Number of InnoDB Buffer Pool Chunk: 88 for 8 Buffer Pool Instance(s)
[OK] Innodb_buffer_pool_size aligned with Innodb_buffer_pool_chunk_size & Innodb_buffer_pool_instances
[OK] InnoDB Read buffer efficiency: 100.00% (306842311629 hits / 306855110556 total)
[!!] InnoDB Write Log efficiency: 78.25% (67462310 hits / 86217100 total)
[OK] InnoDB log waits: 0.00% (0 waits / 18754790 writes)
The most essential part here is: InnoDB Read buffer efficiency: 100.00%. It is also good to use next mysql command, which returns very interesting parameter we are interested at: “evicted without access”:
show engine innodb status \GIf the evicted without access value is not zero, then it means data is getting read into the buffer pool and then pushed out again before it is accessed (also called buffer pool churn). If this value is tracked over time and you see it to go up, then you might need to increase the innodb_buffer_pool_size value. However, you can’t set innodb_buffer_pool_size too large. If you do, that might cause paging in the operating system and can have a negative impact on performance.
After playing with different configurations, observing monitoring, mysqltuner output and “evicted without access” parameter, the final optimal configuration appeared to be the next one:
- databaseB – instance for inserts/updates/delete operations – db.t3.large (2 CPU, 8Gb RAM), Multi-AZ, innodb_buffer_pool_size = {DBInstanceClassMemory*3/4}
- databaseB – read replica – db.t3.large (2 CPU, 8Gb RAM), Single-AZ, innodb_buffer_pool_size = {DBInstanceClassMemory*3/4}
- databaseA – db.t3.medium (2 CPU, 4Gb RAM), Multi-AZ, {DBInstanceClassMemory*1/2 – in that case we had to cut innodb_buffer_pool_size to leave more RAM for operational system, though it appeared to be enough to preserve InnoDB Read buffer efficiency
- some additional adjustments at innodb_log_buffer_size, max_heap_table_size and tmp_table_size parameters were applied to avoid mysqltuner alerts
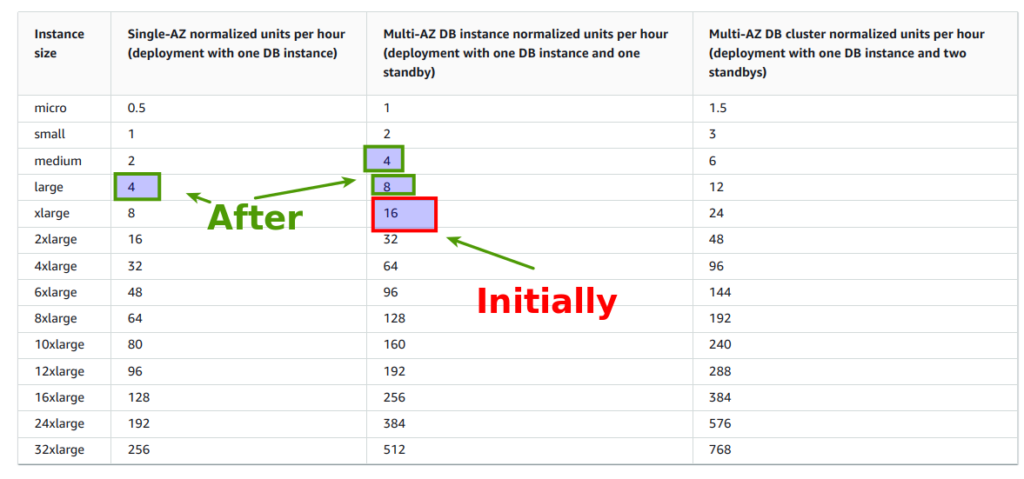
And here is interesting aspect from cost side. Initially we had reservation for the RDS instance db.t3.xlarge – which gave us 16 normalized units per hour. New configuration allowed to preserve the same value:
Though there is one essential thing, which you probably have noticed – read replica is at Single-AZ, which is not high available solution. So, reasonable question appears, why? The deal is we estimated the probability of falling down some zone at RDS (without some announced AWS service works) as really low. Even in case it will happen, we have 24 hour support, that allows us to bring new read replica at new zone within 10-15 min. From business perspective, current risk in pause of app work, relatively to lower cost, is acceptable.
From another side, read replica already works at it’s ~70-80% max “capacity” possibilities, which means, assuming that business would be growing, that another 1-2 replicas will appear at closest future, and it can be deployed at another zone. We also can distribute requests upon multiple read replicas using some proxy, at app side, or maybe even better – using Route 53. Anyway, current configuration works 3 months, and we got rid of from all annoying errors, preserving the same costs, but getting :
- more flexabily
- more control over the system from monitoring perspective
- more scaling possibilities
Personally I am very satisfied with final results. The summary of the story is the next one:
- keeping different databases at one RDS instance can be not always a good idea, even from cost perspective
- splitting read/write operations can resolve DB dead locks exceptions
- AWS RDS memory exploration, the same as scaling down procedure, is rather tricky operation, which requires experience and many attempts to optimize DB work, though it worth to do it.
- AWS RDS monitoring is not perfect. To examine situation in details you will have to go at more low level. MySQL console, mysqltunner and Zabbix – are great tools that can help to find bottlenecks and perform according AWS RDS optimizations for MySQL/MariaDB engines
- using popular frameworks and ORMs abstract layer will allow to write your application in such a way, it can work in read/writes splitting mode, sending requests to DB using different instances. It is very essential feature for further growing. In case you are not thinking about it from beginning – adding such functionality can be very time consuming, or even impossible, at bigger and fast growing services.
Hope you have found current article to be interest. If you are interested at AWS cloud, the same as I am, then, welcome to my Udemy courses, related with it:
- DevSecOps: How to secure web application with AWS WAF and CloudWatch
- AWS devops: Elasticsearch at AWS using terraform and ansible
Best regards