Hi cyber security fans. At 1st part we discussed how to use CloudWatch logs, what is CloudWatch insights and useful Cloudwatch dashboards can be. At current one part we will get closer to application security in DevOps, or maybe even better to say, that together we will apply one rather interesting secure DevOps methodology 🙂
Now you know that we can easily aggregate custom exception logs, generated by our application. That is definitely useful, but we can go further, and using that information, we can create custom CloudWatch metrics and alarms upon it. Let me show you how it looks like from Terraform side, using some simplified example at one concrete case. Lets assume that our application, while throwing critical error, always has the same format for message, which included inside next words: “Critical Error”. Now we can create aws cloudwatch log metric filter in a next way:
resource "aws_cloudwatch_log_group" "flask" {
  name              = local.app_name_full
  retention_in_days = "90"
}

resource "aws_cloudwatch_log_metric_filter" "critical-error" {
  name           = "${local.app_name_full}-critical-error"
  pattern        = "Critical Error"
  log_group_name = aws_cloudwatch_log_group.flask.name

  metric_transformation {
    name          = "${local.app_name_full}-critical-error"
    namespace     = "Application Logs"
    value         = "1"
    unit          = "Count"
    default_value = "0"
  }
}
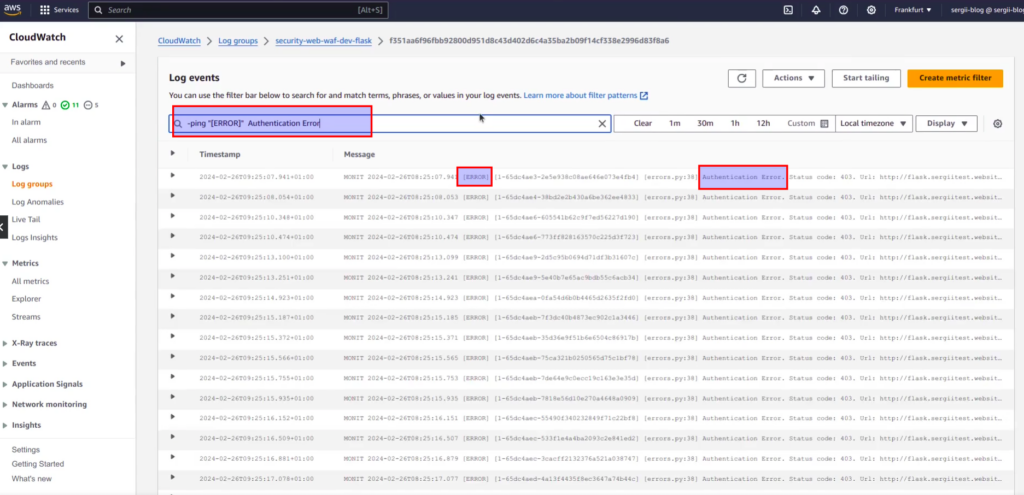
In terraform code, pattern value – it is the same “search phrase” we have type at filter event input within last article to find errors. Let me remind you next screen:

In general, code above means, that we want to count every critical error as 1 and keep it as CloudWatch metric. While having metric, we can go further and create alarm:
resource "aws_cloudwatch_metric_alarm" "critical-errors" {
  alarm_name                = "${local.app_name_full}-critical-error"
  comparison_operator       = "GreaterThanThreshold"
  evaluation_periods        = "1"
  metric_name               = "${local.app_name_full}-critical-error"
  namespace                 = "Application Logs"
  period                    = "300"
  statistic                 = "Sum"
  threshold                 = "10"
  insufficient_data_actions = []
  alarm_actions             = [data.aws_sns_topic.alarm_topic.arn]
}
Short explanation of what is going on here. We calculate number of errors (metric we defined above) at 5 min bins (period = 300), and in case the sum of errors would be more then some defined threshold (it is hard coded as 10 at example, though at real life better keep it as var) the alarm would be raised. Notification about according alarm event would be sent at AWS SNS topic, which can use email, sms or some external API webhook integration with company centralized alarm panel. One essential notice – namespace at metrics and alarm Terraform resources should be the same. At example you can notice that in both cases next value is used: “Application Logs”
In such a way we can create alarms for the most typical application errors: like “not found errors” (code 404), “critical errors” (code 500), “bad requests errors” (code 400), “authentication errros” (code 401, 403) and so on.

We are coming to the point of understanding how application can become a sensitive detector of abnormal behavior. Generally speaking, everything is extremely easy. Let’s think logically about different possible classical scenarios. Below are some 2 examples:
- Hacker is running scrapper trying to get configuration files, that maybe would appear to be downloadable for some human error, or any other stupid reason. Even if it would be done slow, bypassing rate limits of your WAF, which I hope you have (if not, I definitely recommend to view my course “DevSecOps: How to secure Web App with AWS WAF and CloudWatch“), application will return 404 errors, that will raise “not found errors” CloudWatch alarm,
- Somebody is trying to brute force your login form, bypassing captcha. Application is throwing 403 auth error – as result according CloudWatch alarm would be raised very fast.
We can continue our list, but the main here – to understand idea: We can regularly calculate the number of errors and use that as a metric for detection of abnormal behavior. In case some threshold would be exceeded – then we can raise alarm. Of course, to make it to be working you need to take care about:
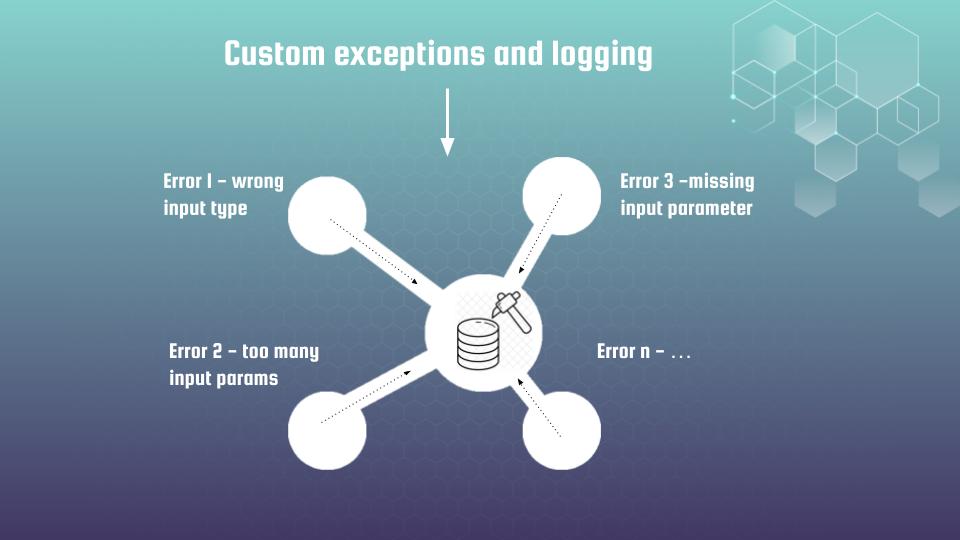
- well structured exception and logging formats
- application has to throw “correct” exceptions and code errors when something is no yes
Using an application as a sensitive detector of abnormal behaviour is able to notify us about an attack before WAF will detect it, or when WAF could not deal with the problem. When we know about the attack – it is already half of success, as now we can analyse it on an ongoing basis, gather IP addresses related with malicious activity and block it at WAF level using black lists.
All those aspects, different hacker’s attacks scenarios and secure DevSecOps methodologies against it, the same as real practical examples at real security AWS lab environment, are discovered deeply at my course, the “DevSecOps: How to secure Web App with AWS WAF and CloudWatch”. Here you can find coupons with discounts, which are updated rather regularly. If you are interested at cyber security theme, don’t hesitate to click enroll button below. Thank you for you attention.
