Hi, DevOps enthusiasts! This article is dedicated to the subtleties of AWS Fargate autoscaling, which can surprise even experienced DevOps engineers and server administrators.
So, the first surprise is that scaling speed is limited and follows certain inertia laws. It’s best to explain this with a concrete example. Let’s assume we are scaling the number of Fargate containers based on CPU utilization. We set the desired utilization to 80%, but the load increased, and the actual value reached 90%. AWS scales out by just the right number of tasks to bring the CPU utilization from 90% to your target of 80% using the following formula:
current_task_count * ( actual_metric_value / target_metric_value ) = new_task_countLet’s calculate 2 examples, one for current_task_count = 10, and another one – for current_task_count = 40
10 * (90/80) = 11

40 * (90/80) = 45
What we need to understand is that the current ratio (actual_metric_value / target_metric_value) determines the maximum “magnitude” of a scale-up event. Since the CPU’s maximum value is capped at 100%, if you are targeting high CPU utilization values, say 90%, your ratio would only be 1.1.
You might say, “Okay, Sergii, you know how to use a calculator, but where’s the problem?” The issue arises when your application experiences drastic fluctuations in traffic. Let’s assume traffic suddenly increases by 200%. To handle this overload, you might need to double the number of containers accordingly. For simplicity, let’s say you currently have 10 containers running. To reach 20 containers, you would need to wait for 7-8 scaling events.
10 × 1,1 × 1,1 × 1,1 × 1,1 × 1,1 × 1,1 × 1,1 -> 19.48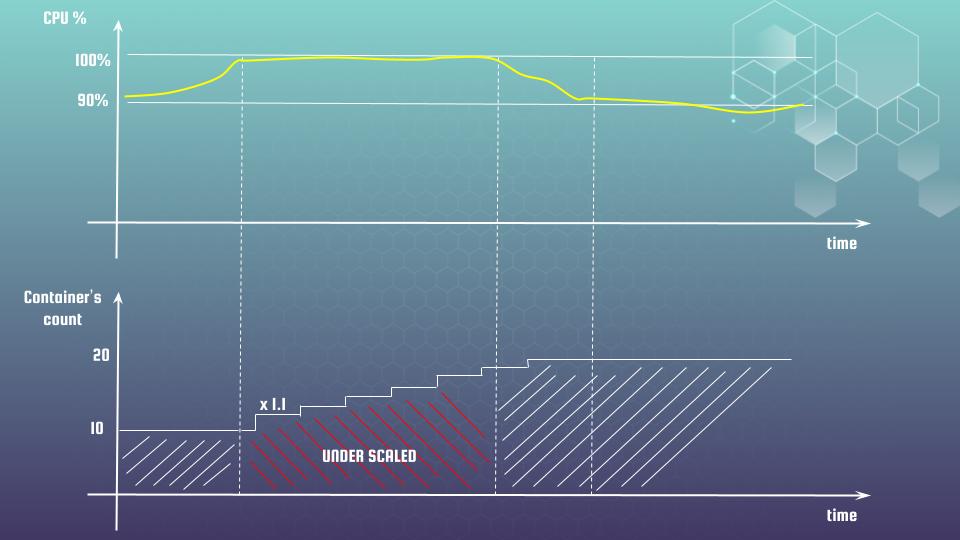
So, for a certain period, you will be under-scaled. How can we address this situation? Being unavailable, even for a short time, is not ideal, right? However, in practice, as shown in our example, this under-scaling can easily last even 20-30 minutes. Here are several possibilities we can consider:
- Increase the Ratio of Actual Metric Value to Target Metric Value: This means decreasing your target value. While this may provide some relief, it only helps slightly. Setting the target value too low can lead to over-scaling, and we want to avoid incurring higher costs.
- Add Target Tracking on a Custom CloudWatch Metric: This involves using a custom CloudWatch metric where the actual_metric_value is not limited. For web services, this could be the number of specific requests that you track in your application and send as a custom CloudWatch metric. Alternatively, it could be the backlog per instance, which is explained in detail’s at my course: “AWS Fargate DevOps: Autoscaling with Terraform at practice“.
- Use Shorter Scale-Out Cooldown Periods: Reducing the cooldown periods will increase the frequency of scale-out events, allowing you to respond more quickly to changes in demand.
Let’s talk more about “cooldown”. Fargate allows for the specification of cooldown parameters, helping to manage the timing and frequency of scaling events effectively:
- Scale In Cooldown: This parameter specifies the amount of time, in seconds, that must pass after a scale-in activity completes before another scale-in activity can begin.
- Scale Out Cooldown: This parameter indicates the amount of time, in seconds, that must pass after a scale-out activity completes before another scale-out activity can start.
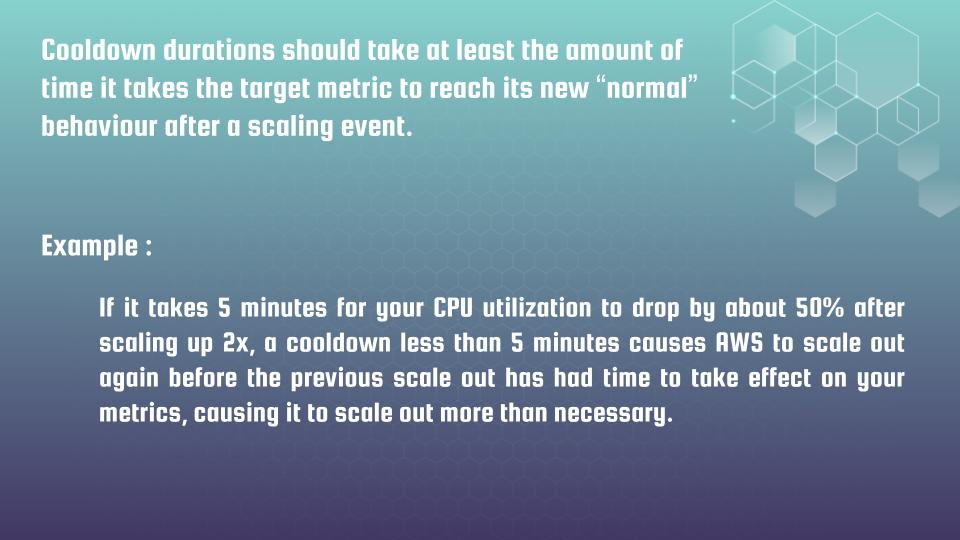
The “cooldown” period defines the minimum amount of time that must pass between subsequent scaling events in the same direction, with a default value of 5 minutes. It’s important to understand that these cooldown values cannot be set too short, as doing so may lead to over-scaling or under-scaling. The cooldown durations should reflect at least the time it takes for the target metric to return to its new “normal” behavior after a scaling event.
Example: If it takes three minutes for your CPU utilization to drop by approximately 50% after scaling up 2x, setting a cooldown period of less than three minutes would cause AWS to scale out again before the previous scale-out has had time to take effect on your metrics. This premature scaling could result in unnecessary resource allocation.
It may sound complicated, but take a moment, read it carefully, and reflect on the current statements calmly.
One more surprise:
Additionally, CloudWatch typically stores your target metric in one- or five-minute intervals. The cooldown associated with those metrics cannot be shorter than that interval. If it is, CloudWatch may re-evaluate the alarms before the metrics have been updated, leading to another potentially incorrect scaling event.
Despite these surprises, the autoscaling is a very powerful tool. With the right approach, it allows you to scale containers quickly, even when facing significant fluctuations in traffic. However, it is not a silver bullet. Let’s discuss when it works best:
- Directly Affected Metrics: There should be at least one metric that is directly influenced by the running task count. For example, a web service uses twice the amount of RAM when handling twice the volume of requests, making memory utilization a good target metric for target tracking scaling.
- Bounded Metrics: The metrics you target should have reasonable upper limits, and their range should not be overly broad; otherwise, you may encounter issues with high costs.
- Stable and Predictable Metrics: Your target metrics should be relatively stable and predictable under a consistent load. If your target metric fluctuates wildly even at relatively stable load levels, your service may not be suitable for target tracking scaling. AWS will struggle to correctly adjust the task count to align with the target metrics in the right direction.
That’s all I wanted to share about the surprises of AWS Fargate autoscaling. In the upcoming articles, I will demonstrate how to implement different autoscaling options in practice using Terraform, including:
- Predefined tracking autoscaling policies for memory and CPU utilization.
- Step-based CPU autoscaling.
- Autoscaling with a predefined custom SQS CloudWatch metric.
- Step autoscaling based on the number of ALB requests within an AWS Target Group.
If you don’t want to miss any of this content, please subscribe to my newsletter.
If you’re eager to learn right away or prefer a faster and more convenient approach, I invite you to join my course where you can access all the material efficiently. Be sure to check for discount coupons, which I update regularly in the middle of each month.