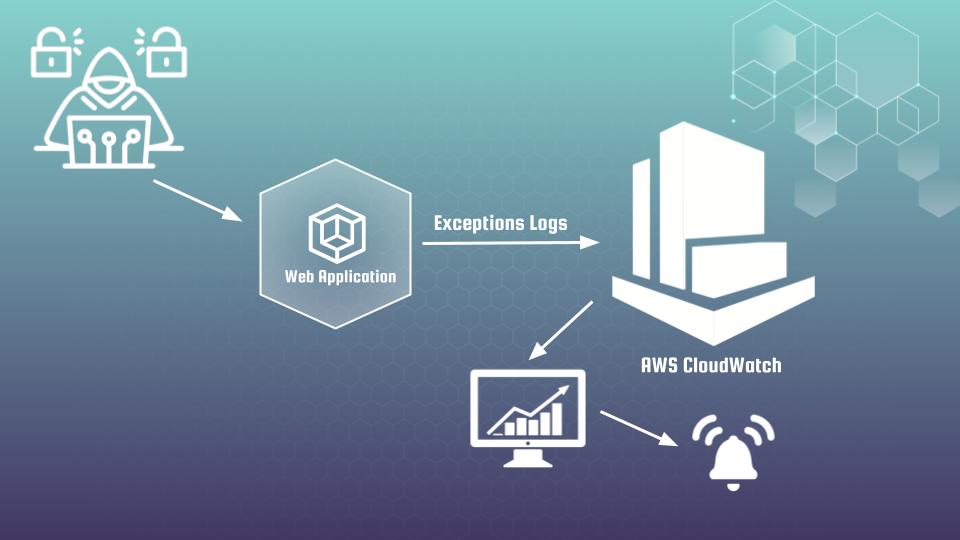
Hi cyber security fans. Welcome to the article “Application and AWS CloudWatch as security monitoring tools”, where we will speak about some DevSecOps best practices and not only. The article is built within 2 connected parts:
- How to use CloudWatch logs, understanding Application logs with CloudWatch insights and dashboards.
- Custom CloudWatch metrics and alerts as sensitive detector of abnormal behavior.
That is the 1st part, where I will try to describe shortly how to work with Application logs using different AWS CloudWatch functionalities and tools.
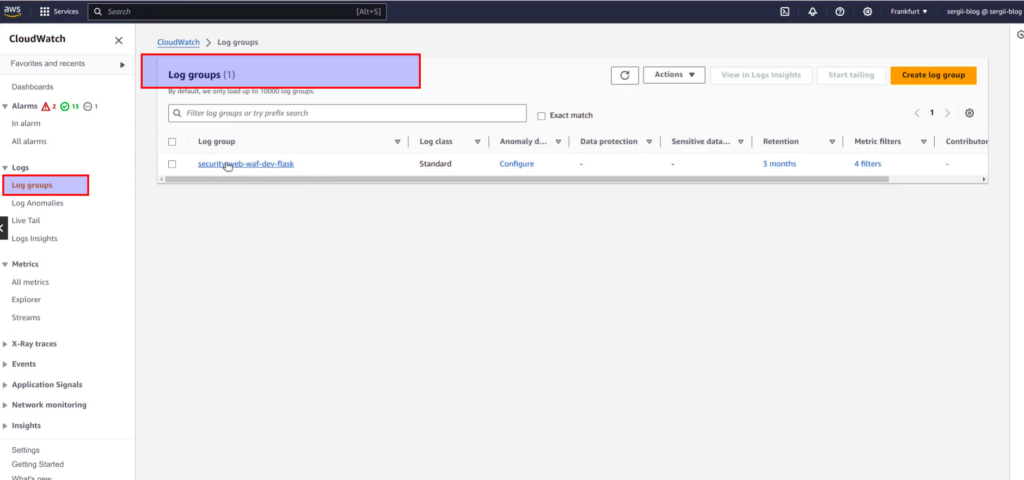
AWS CloudWatch is a monitoring and management service provided by Amazon Web Services, that allows users to collect, track, and analyze metrics and logs from different resources. While opening CloudWatch service you will find “Logs group” at left side of menu. After clicking on it, you will get the list of logs from different applications. At screen below you may see example of log group defined for registration log’s events from test Flask web application, which is represented at Udemy course “DevSecOps: How to secure Web App with AWS WAF and CloudWatch“.
If you will go inside log group, next view would appear:
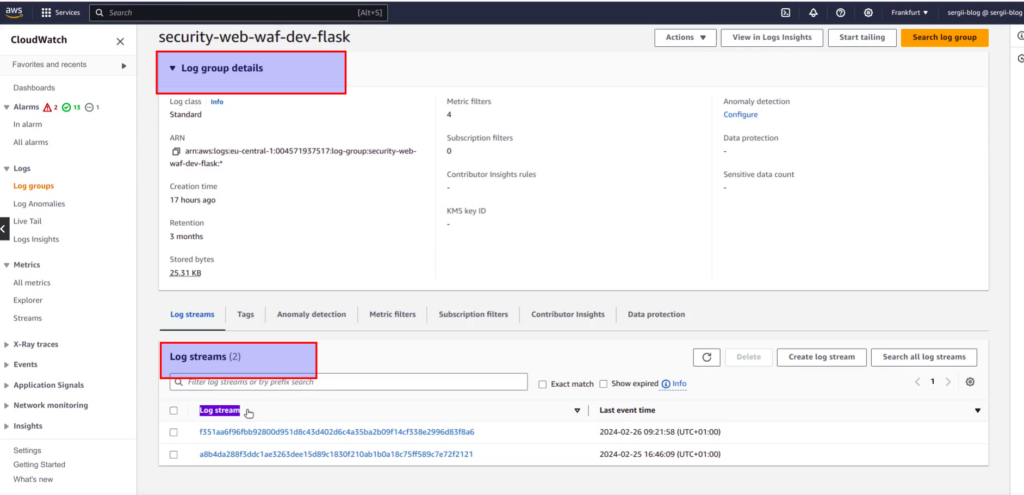
Log group has inside logs streams. Log stream – it is the sequence of log events that share the same application. Here you can see that every time I deployed a Flask application on different days – CloudWatch created a separate log stream for it. Let’s choose the last stream for our learning purpose and go inside. You will see list of log events, the most fresh one would be at the top. The first filter that you can apply – is using date and time preferences. You may click at “Custom” section and set a custom absolute or relative date time window, or you can use predefined time steps: 1m, 30m, 1h and 12h.
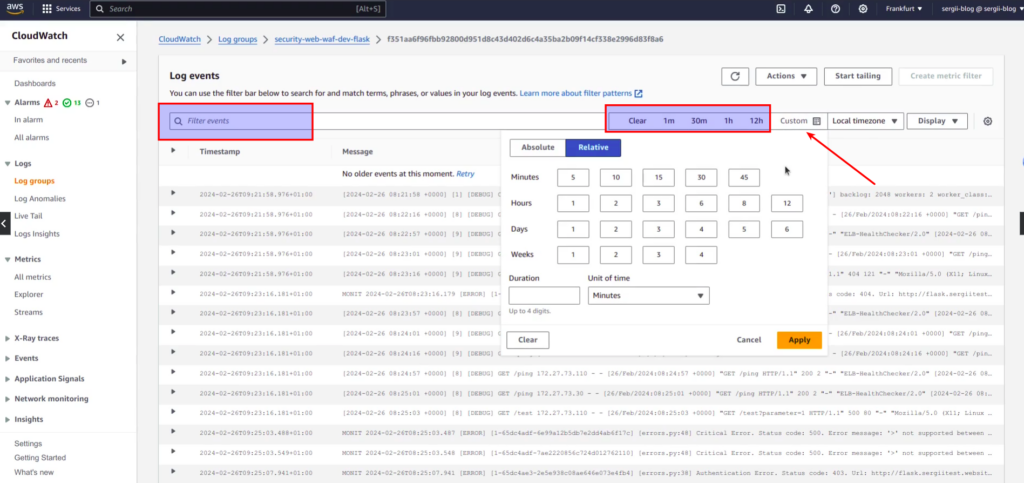
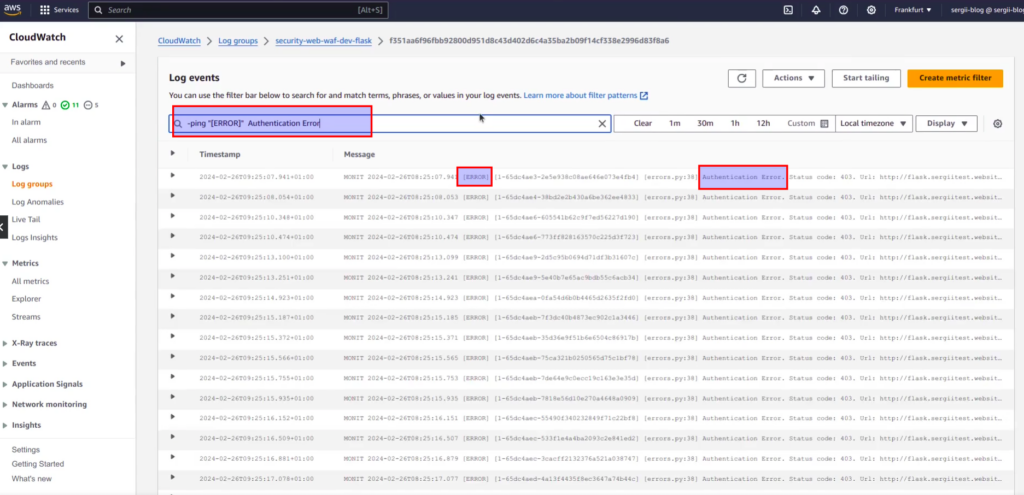
Here you will also find filter events input, which is really easy to use for fast filtering. In case you want to exclude some records from logs – use minus. For example, at screen above, you can see a lot of ping requests from ALB. If we are not interested in it (which is in most case true), to filter out those events from our further investigation, it is enough to type at input: “-ping”. In case we want to filter in addition only some exact records – e.g ERRORS related with Authentication, we can easily add according condition. At screen below you can see final filter pattern and search results:
Of course, to be able easily filter your logs, it is indeed good to have well structured predefined log’s structure and format. That is very essential aspect, which I am explaining in details at my course devoted to cyber security of web applications. Unfortunately current material is out of the scope of current article, as it would indeed hard for me to explain all at once. But I hope that it will not be an obstacle for understanding the main idea.
It is also worth to mention, that the same way as we have just performed filtering upon one log the stream, exactly the same we can do the similar operations at all streams within log group at once. But we can do even much more. We can aggregate different types of logs at buckets and visualize it. Let me show you how to do it.
AWS CloudWatch has one interesting functionality. It is called “Log insights”. Here we can perform advanced queries against log data using special syntax. If you want to get acquainted with it at fast, I recommend to view real practical examples at “Queries” help from right side panel. It is better to start from “Common queries section”.
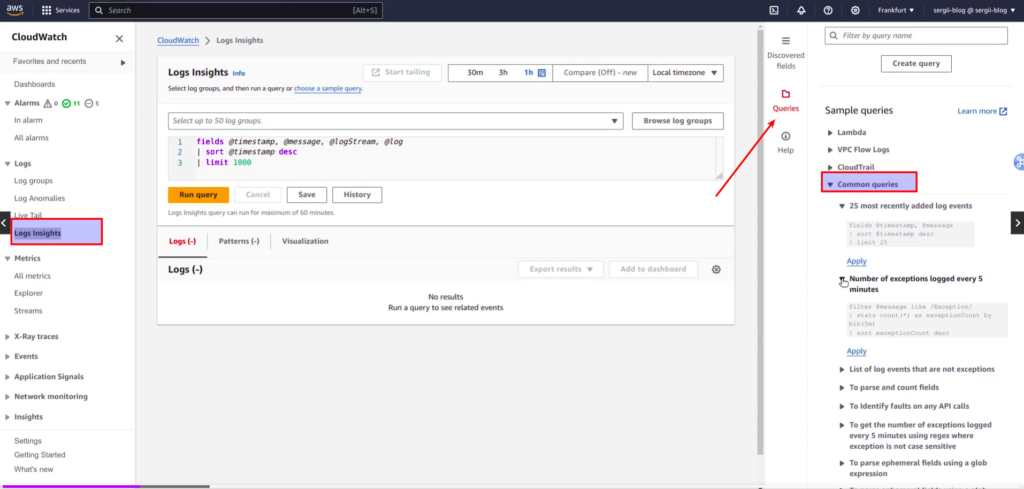
First of all you need to choose a log group. Then we need to choose what fields we want to select. Let’s choose messages, and then apply some “magic” – get all errors from application, they are tagged with special prefix MONIT, and count the number of errors within 5 min buckets.
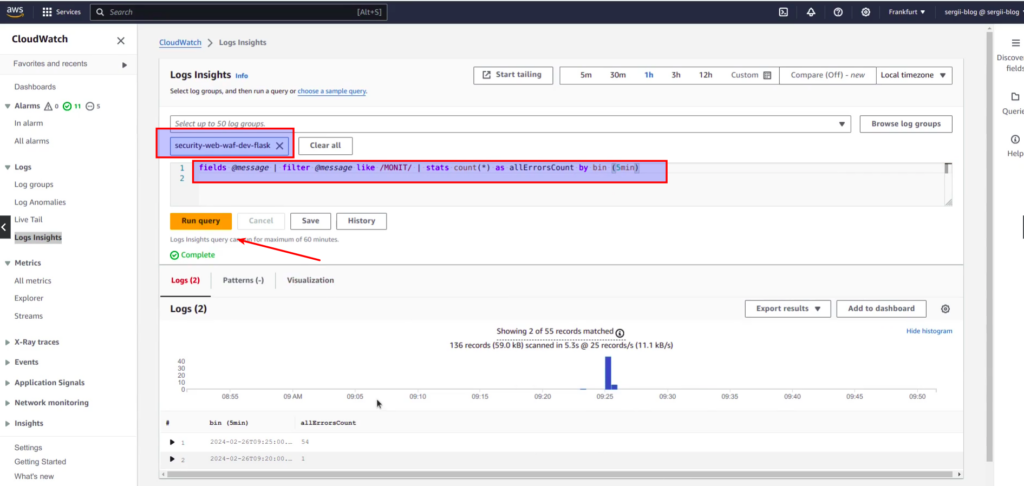
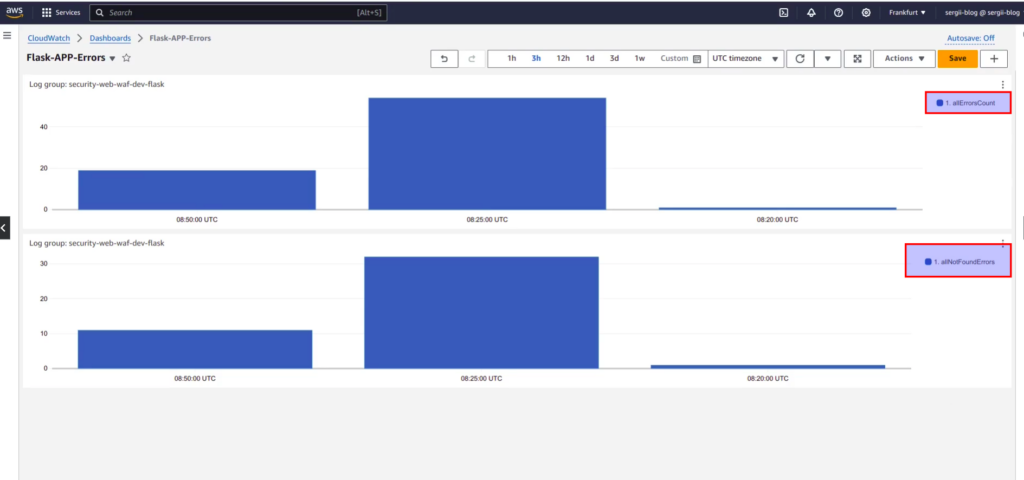
In such a way you can get distribution error graphs, which can be visualized and added to UI dashboard. You may also create dashboard for different types of errors. Such visualization will help you to analyse and understand the logs from your application. Here is some small screen from my course that will give you some understanding of what exactly you can get in the end:
If you are interested at current theme more, then welcome to my course, link to which you can find below 🙂 Anyway, I hope that you are starting to feel the power of AWS CloudWatch service.
After you will understand how application errors are distributed within different hours and different days, you may go further and set thresholds for different error types. Let’s discuss how to do it in the next article. If you are not ready to wait and want to pass all material faster in a more efficient way, then I propose you to view my on-line course at udemy.
