Hi, everybody
At current article I decided to share with you my commercial experience around Nuxt framework. Within last 2 years, using Nuxt appeared to be not so pleasant adventure. And it is not related with coding, or code architecture – but mostly at how Nuxt applications were working at real production. The main reason here, that most JS modern tools, like React, Angular, Vue, or even more higher abstract frameworks/layers upon them: as Next, Angular Universal or Nuxt, create a situation at IT, which I would like to compare with Car’s market.
Some 10 years ago, developer, like a car’s mechanic, understood how all works under the hood, but today situation is quite a different. What happens nowadays, when you come with a modern non-working car to the workshop? In most cases you will hear something like that: “Hard to say what is that, there is too much electronics today, better simply to replace that, and that part, as nobody knows how to repair it”. You perform according actions, and it appears later, that reason was at some simple fix – but because current systems are too complicated and all working as a “black boxes”, there is no deep understanding how indeed all system performs.
And it is probably OK – it speed up different processes and push up our growth. But there is negative side of coin also. When something is not working – it is hard to fix the problem without deep understanding of the system, and to get that knowledge – you need a lot of time. That is was my case with Nuxt framework. The company, I am working regularly at, was using Vue within over last 5 years, and natural decision appeared from developers side to switch at Nuxt – to make our life easier and “to keep up with the times”. 🙂
And here problems started for me as CTO – often memory leaks, CPU problems, strange bugs and errors. Within last year I understood, that all those problems were not caused by Nuxt as framework by itself. The most reasons were much more deeper:
- lack of experience – every new technology requires adaptation and learning
- lack of deep understanding how SSR and Node, which we did not use earlier, works
So, let me share with you some useful tips and tricks, that I hope will safe your time. Let’s start from debugging bottlenecks. Let’s assume that we have some dockerized Nuxt application exposed at port 8080 and our simplified Docker file with local env looks like the next one:
FROM node:20.11-alpine3.19 as frontend
...
COPY docker-entrypoint-app.sh /root/docker-entrypoint-app.sh
EXPOSE 8080
ENV PORT=8080
....
ENTRYPOINT ["sh","/root/docker-entrypoint-app.sh"]
It is not some working Docker file – only some parts of it to describe the main idea. And here is our entry-point script:
#!/bin/bash

yarn

node node_modules/.bin/nuxt --dotenv .env.local
Now, question appears, how can we debug Node bottlenecks. Here, I recommend to use 2 methods, which I will show how to configure within that article below:
- debug mode for node with chrome dev tools
- flame charts
Let’s start from the 1st option. First of all we need to switch Node server in debug mode. To do it we need to modify our docker entry point at the next one option:
node --inspect=0.0.0.0:9229 node_modules/.bin/nuxt --dotenv .env.localAt next step you need to remember to expose debug port at Dockerfile
EXPOSE 9229In case you are using docker-compose, you will also have to add port mapping – something like that:
ports:
    - "9229:9229"
Now you may visit Google Chrome -> navigate to chrome://inspect/#devices. Connect to debugging port and click at inspect:
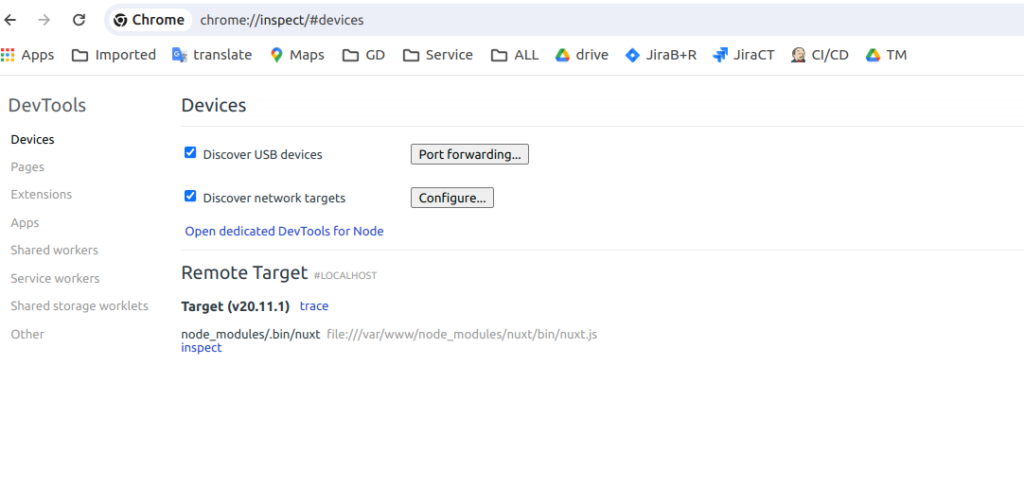
That will open DevTools – > click at record to start gather profiling data:
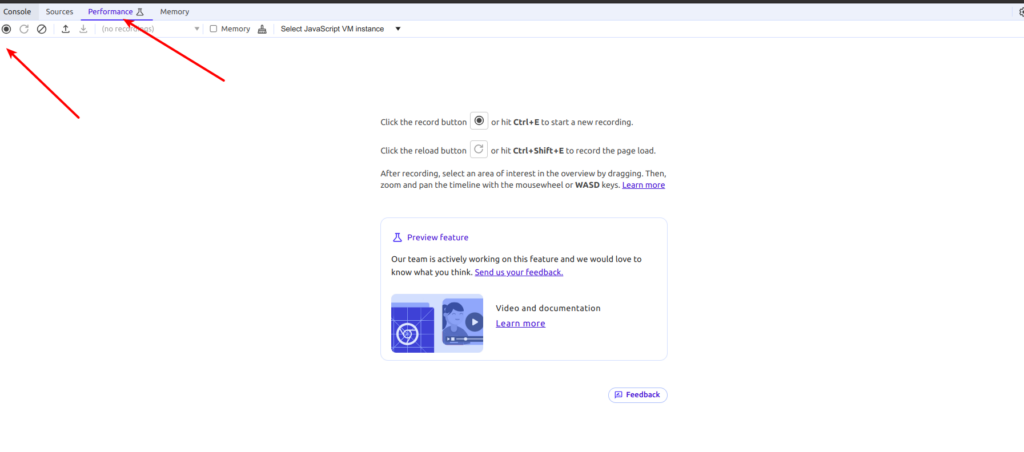
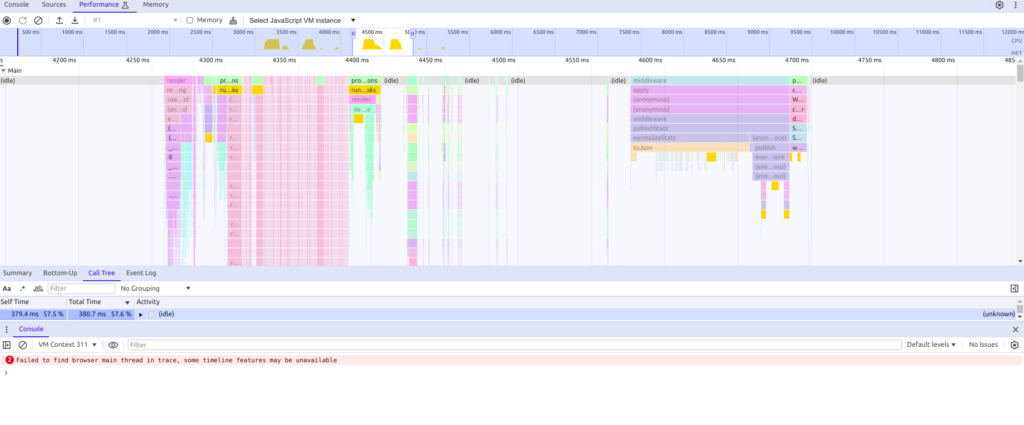
After that you may overload your application with any tool like: Apache Benchmark, JMeter, autocannon. Stop profiler after making overload test of chosen by you url. After that you will see something as at screen below – that will help you to can examine narrow CPU places.
Chrome DevTools also can help you to debug memory issues – by using memory snapshot mechanism. It is out of the scope of current article, but if you are interesting – please, write me at email, in case bigger interest from readers I will add according material.
There is also another useful tool that you can use for debugging Nuxt application bottlenecks from Node.JS side – it is using the 0x tool to profile server and generate a flame graph. To do that, we will need to install 0x profiler package at our docker environment. We will also need to make a little trick to force our container to be not exited – add some long sleep 🙂 Here is the final modified entry point bash script
#!/bin/bash

yarn

npm install --global 0x
sleep 400000000
Now you may enter inside docker container and run next command:
0x node_modules/.bin/nuxt --dotenv .env.localThat will start node server with 0x executable binary as a profiler wrapper. After that you may overload your application with any tool like: Apache Benchmark, JMeter, autocannon. Then return to the docker terminal session and press Ctrl+C. The output will detail the location where 0x has generated the flame graph. After you will open html report file, something like that will appear:
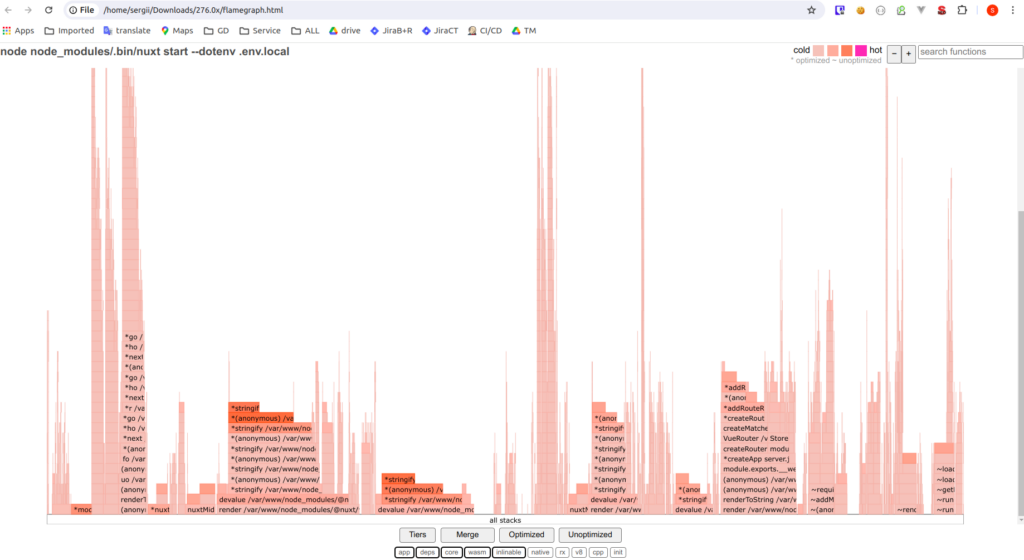
That will allow to identify “hot” places in your code. Despite current tools are definitely helpful, in my exact case it appeared to be not enough. Further exploration showed that Nuxt has a lot of problems from architecture and server side by itself.
Nuxt 2, that is the version I would be speaking further, compiles a lot of code in one server.js file. Current code should be processed at every request, which is far from optimal decisions. It appeared that there are several possible solutions for that, which are not self-excluded:
- break our front application at smaller micro services to reduce number of code. We made some initial tests to move out from application some smaller domain as microservice – it showed 5x speed up in performance for domain functionality.
- migrate at Nuxt 3, which has much more efficient server solution – a decision to provide migration and start to create new things at more fresh Nuxt version was accordingly taken. The problem with the server appeared to be rather well known in the VUE community. It was so deep, that the NEXT2 server was replaced with a completely new type at 3d NUXT edition.
But the biggest surprise, or maybe better to say small shock, was fact that any server solution, despite it’s version, is not configurable at “multiple threads” angle. I came out from backend world of PHP, Python, Java, .NET. And I already used, that in all backend application multi thread processing at Web servers level is like a standard. You get it of the box, and only some adjustments are required from time to time. But it appeared that at front end world is another one :). Moreover, developers are mostly really rarely interested at infrastructure details, so no one paid attention at fact that our Nuxt application is running at one CPU thread.
Solution was found rather fast – we installed pm2 process manager for Node.JS, so our entry point took next view:
#!/bin/bash

pm2 start --no-daemon
And it was enough to add small file configuration to Nuxt framework
/**
 * This is pm2 configuration file
 * https://pm2.keymetrics.io/docs/usage/application-declaration/
 */
module.exports = {
    apps: [
        {
            name: 'Frontapp',
            exec_mode: 'cluster',
            instances: 'max', // Or a number of instances
            script: './node_modules/nuxt/bin/nuxt.js',
            args: '. start',
        },
    ],
}
Finally, after many months of fights with Nuxt daemons, our application started to be working as it should be. All above mentioned steps allowed to boost up Nuxt performance. Though, we still meet unpleasant memory leak surprises from time to time :). By the way, I recommend to get acquainted with rather interesting article represented by Glovo team “Memory Leaks in SSR Web Apps” – their experience with memory problems and Nuxt seems to be similar 🙂
In my opinion, Nuxt is neither better nor worse than other modern popular JS frameworks and tools. React, React Native, Angular – all of them, as any other tools, have their own problems. Despite I don’t have commercial experience with Angular, but I have with the 1st two. Every of today’s front end solutions have their own pros and cons. The using of according tool is determined by many factors, which I prefer to avoid here. What I can recommend – continue to learn, and never give up. Best regards.